See A Satellite Tonight is my most successful side project so far, with 5 million users since launch in 2019. It's been entirely a solo project, and I've used it as a proving ground for a bunch of tech that I wanted to learn. It took dozens of APIs and services to put together the experience I wanted: 
In this post I'll describe how it all works. Frontend tech, satellite-related calculations, backend tech, plus a little about my motivations for building the site.
Frontend tech
See A Satellite Tonight is a very client-heavy site. It's a single-page application that is written mostly as a single file, HTML and JavaScript and CSS all together. If I was collaborating on the site with others I might try to separate things out more, but I really like the option to keep everything in a single file for solo development. I miss the simplicity when I develop for other platforms.
I wrote the site with vanilla JavaScript, no frameworks and no build process. It's not obfuscated, so you can see the code in the web inspector, though it wasn't structured to be readable by others 😀
Satellite calculations
The core task that See A Satellite Tonight performs is calculating exactly when and where a satellite will be visible to you. How does this calculation work?
First, I need to know where you are. The browser's Geolocation API is used for that. Of course I have to ask permission to use it, and the user may deny it. This is tricky because I can't display anything useful without asking for geolocation first, and the user may not understand why it's necessary, or be suspicious of data collection. I only use the geolocation data client-side and don't send it to the server, but the user has no way of really verifying that. If the user denies geolocation permission, I fall back to IP geolocation. But this isn't precise enough for the site's best feature, Street View, to work. So in that case I replace the Street View display with a search box inviting the user to enter their street address, backed by Google Maps's geocoding API, and carefully constructed for browser autofill to work. Autofill likes to split the user's address into many different fields like street number, postal code etc, which is not at all necessary. So I have a bunch of hidden form fields for autofill to use, and when they get filled I move that data back into the main search field.
Now that I have the user's location, I need to figure out where the satellites are. At page load, the first thing that happens is a request for satellite ephemeris (orbit) data from /satellites/brightest-sats.txt. This request returns Two-line elements (TLEs) for every satellite that is potentially bright enough to be visible to the human eye (currently 774 satellites as I write this). This data comes from the US Space Force 18th Space Defense Squadron for most satellites, and Celestrak for Starlink. The TLEs describe an orbit for each satellite, but we're still far away from what we want: a list of times that satellites will be visible.
Now it's time for some math. First I need to calculate the position of each satellite over time. The process of turning a TLE into a position at a specific time is called "orbit propagation", and it is done using a standard piece of code called SGP4. I believe SGP4 was originally written in Fortran in the 1960s. It's been ported to many different languages, including JavaScript, but I decided to use the C++ version both for speed and accuracy. The C++ version is likely what is used when the TLEs are originally generated, and numeric code like this can often have subtle rounding issues after porting to other languages, so it's best to use the same implementation if possible. Luckily Emscripten makes it relatively easy to reuse C++ code on the web.
Using the C++ SGP4 propagator running in WASM, for each TLE I calculate the satellite's position (in ECEF coordinates) every minute for the next 5 days (7200 minutes). I spread the calculation over a few Web Worker threads to avoid hanging the UI and take advantage of multicore processors. Now for each minute we want to calculate whether the satellite will be visible. This is a complex calculation which requires a lot of simplifying approximations. Here are the factors we need to consider:
- Is the satellite position more than a couple of degrees above the horizon at the user's location? This is a straightforward geometric calculation, given ECEF coordinates for the user and satellite, and the Earth's surface normal at the user's location (which is not just the normalized ECEF coordinate because the Earth is not exactly a sphere).
- Is the satellite lit by the sun, or in Earth's shadow? Satellites, like the Moon, don't emit their own light, and can only be seen when they reflect sunlight. Unlike the Moon, low orbiting satellites are in Earth's shadow almost half the time, so this calculation is very important.
- How far away is the satellite from the user? Brightness decreases according to the inverse square law.
- How much sunlight is the satellite reflecting in the user's direction? In reality this depends on the exact size and shape and orientation of the satellite. The size is easy to model, but the shape and orientation are difficult or even unknown. So we can take the satellite's size, assume it's a sphere, and calculate its "phase" as if it was the Moon. This is not a great approximation, and someday maybe I can do better with specific knowledge of the shape and orientation of different satellites. This is a geometric calculation using the positions and relative angles of the satellite, user, and Sun. Here's some information about how it's done.
- How bright is the sky above the user? If the sky is brighter than the satellite, then the user won't see it. There are a few sub-factors to consider:
- Is the Sun above or below the horizon? If below, how far below? I use the Sun position calculated by the excellent Cesium library, and visibility tables from this paper.
- Is the user near a city with bright lights? (I'm not calculating this yet, but there is some data available about sky brightness due to city lights, so it's probably possible to do.)
- Is the Moon out? How bright is it? How close is the satellite to the Moon? (I don't actually calculate this yet)
- How much of the satellite's light is blocked by the atmosphere? This depends on the height of the satellite above the horizon. The closer to the horizon, the longer the light has to travel inside the atmosphere, and the more will be blocked. It also depends on atmospheric conditions including clouds and smog and even the seasons, but I'm not currently accounting for those. I'm using some tables from this paper for this calculation.
Whew! After all that is done, I apply a brightness threshold to calculate a binary "is visible" value for each satellite at each minute of the next 5 days. Then I can aggregate those into a list of time periods for each satellite. In one final step, if multiple satellites are visible at the same time I combine their time periods together into one larger period. This is mostly for Starlink since you can easily have 40+ satellites going over at around the same time, and showing 40+ separate viewing times would be excessive.
User interface
I wanted the site to appeal to people who have no idea about space or satellites at all. 3D graphics don't just look flashy; they can give a good intuitive sense of what's going on. I wanted people to appreciate that they're really seeing satellites traveling in orbits above them, and not just abstract dots in the sky. I'm using the excellent Cesium library for the 3D globe visualization, and also for some of the satellite visibility calculations. Cesium is free, but they charge for use of high resolution globe imagery. I solved this problem by hosting low resolution globe imagery myself, and not allowing you to zoom in so you can't tell it's low resolution. Zooming in the 3D view wouldn't really improve the functionality of the site anyway, so it's not a big loss.
Of course the most important feature of the site is the Google Street View integration. This is what really shows you where to look to find the satellite, and it's a unique feature that no other site offers. The reason for this is probably that Street View is expensive! $7 per 1000 page views, currently. This ruins my whole free hosting plan. I initially relied on Google Maps API's $200 free monthly allowance. But this was quickly exhausted! Thankfully, Google has a process for providing free Maps API credits for educational usage in the public interest, and I was able to qualify. Without these credits, I'd probably have to shut off the Street View feature. So thank you Google!
Street View has a pretty extensive API. Using the API and some geometric calculations, I'm able to synchronize the Street View display with an overlaid 2D canvas with a planetarium view of the sky, showing stars, constellations, and the satellite you want to see. For the planetarium view I'm using a library called VirtualSky with a few customizations.
When I first overlaid the planetarium view over Street View, it looked really weird. Almost all Street View images are taken during the day, and stars showing on a blue sky not only looked weird, but were very difficult to see. Luckily, the web platform provides some powerful tools that helped me fix this problem. I was able to apply SVG/CSS filters to the Street View element. With some color and brightness and contrast shifting, the Street View images can look kind of like they were taken at night, with a dark sky that works a lot better with the planetarium view. Safari's filter support lags other browsers, but even in Safari I was able to make something passable and solve the problem of showing stars over daytime Street View images.
I thought it wasn't obvious enough that the animated satellite view was showing a time in the future, and also animating much faster than real time. So to make this more obvious, I built a video player style seek bar that's shown at the bottom of the screen. Hopefully this makes it more obvious to people that the site is showing an animation faster than real time.
Reminders
Reminders were another issue I wanted to solve. Most of the time when someone visits, the site will tell them about a satellite passing over hours in the future, and they are sure to forget about it by the time the satellite is actually overhead (I know I do). So I put a gigantic red button to schedule a reminder, and also added a subtle "shine" animation to make it even more eye catching. But how can a website remind you in the future? My initial idea was to use the Web Notifications API.
After implementing the Web Notifications API, I was disappointed. Of course users are skeptical of the notification permission prompt, because the only people using it are trying to spam you. And I discovered why: timely web notifications are broken on Android. They may be delayed for hours, it's a known issue, and the Chrome/Android teams have given up on finding any solution. This is extremely frustrating, and makes the Notifications API useless for anything but spam. Of course there's also the issue that Apple has intentionally omitted the notification API from iOS Safari in order to force developers to publish through their App Store instead. So the Notifications API is not worth using on any platform, and I wouldn't bother implementing it today. I wasted a lot of work setting up a whole separate backend on Firebase just for the required server side parts.
So how can we actually do reminders on the Web, if the Notifications API has failed us? Thankfully there is another way: Calendar events! On iOS and Android you can link directly to the user's calendar app, pre-filled with an event that will show a reminder at the given time, and the user just has to click "save". On desktop it's a little trickier; for people who use Google Calendar you can simply link to it, but for people who use Outlook you have to generate and download an iCal file. There's no way to know which calendar the user prefers, so I present the user with a choice. Once the event is on the user's preferred calendar the notification works perfectly every time, because unlike web browsers, calendar applications have solved the problem of presenting timely notifications.
Hidden features
There are several non-obvious features of See A Satellite Tonight.
Past viewing times and future reminders
If you scroll the list of satellites, you'll find two special links.
Past the end there is a link to give you a reminder in 5 days to check back for new data. The site only shows 5 days of predictions at a time because the predicted satellite paths start to become less accurate farther in the future.
Before the beginning of the list is a link to a special mode that shows satellite passes that already happened in the previous 5 days. If you saw something yesterday and aren't sure what it was, this could help you identify it.
Real-time mode
When a satellite is currently overhead, the site switches to a real-time mode that shows the exact current position of the satellite, so you can look in the right place. As soon as the satellite goes out of view, the next hidden feature pops up:
Survey
I wanted a way to verify that people were actually able to see the satellite passes that I predicted. So I added a survey. If you have the app open when a satellite is actually overhead, or if you use the mode that shows past viewing times, it will show some buttons labeled "I saw it" and "I didn't see it". You can also optionally send your precise location along with your answer.
This data is shown in a dashboard I made in Google Data Studio. I had originally intended to use this data to improve my satellite brightness models, but after doing some analysis I concluded that the data was too noisy to be useful for that purpose. It's still good to have some verification that people are seeing the satellites, so I left the survey in.
Here's a look at the most recent survey results!
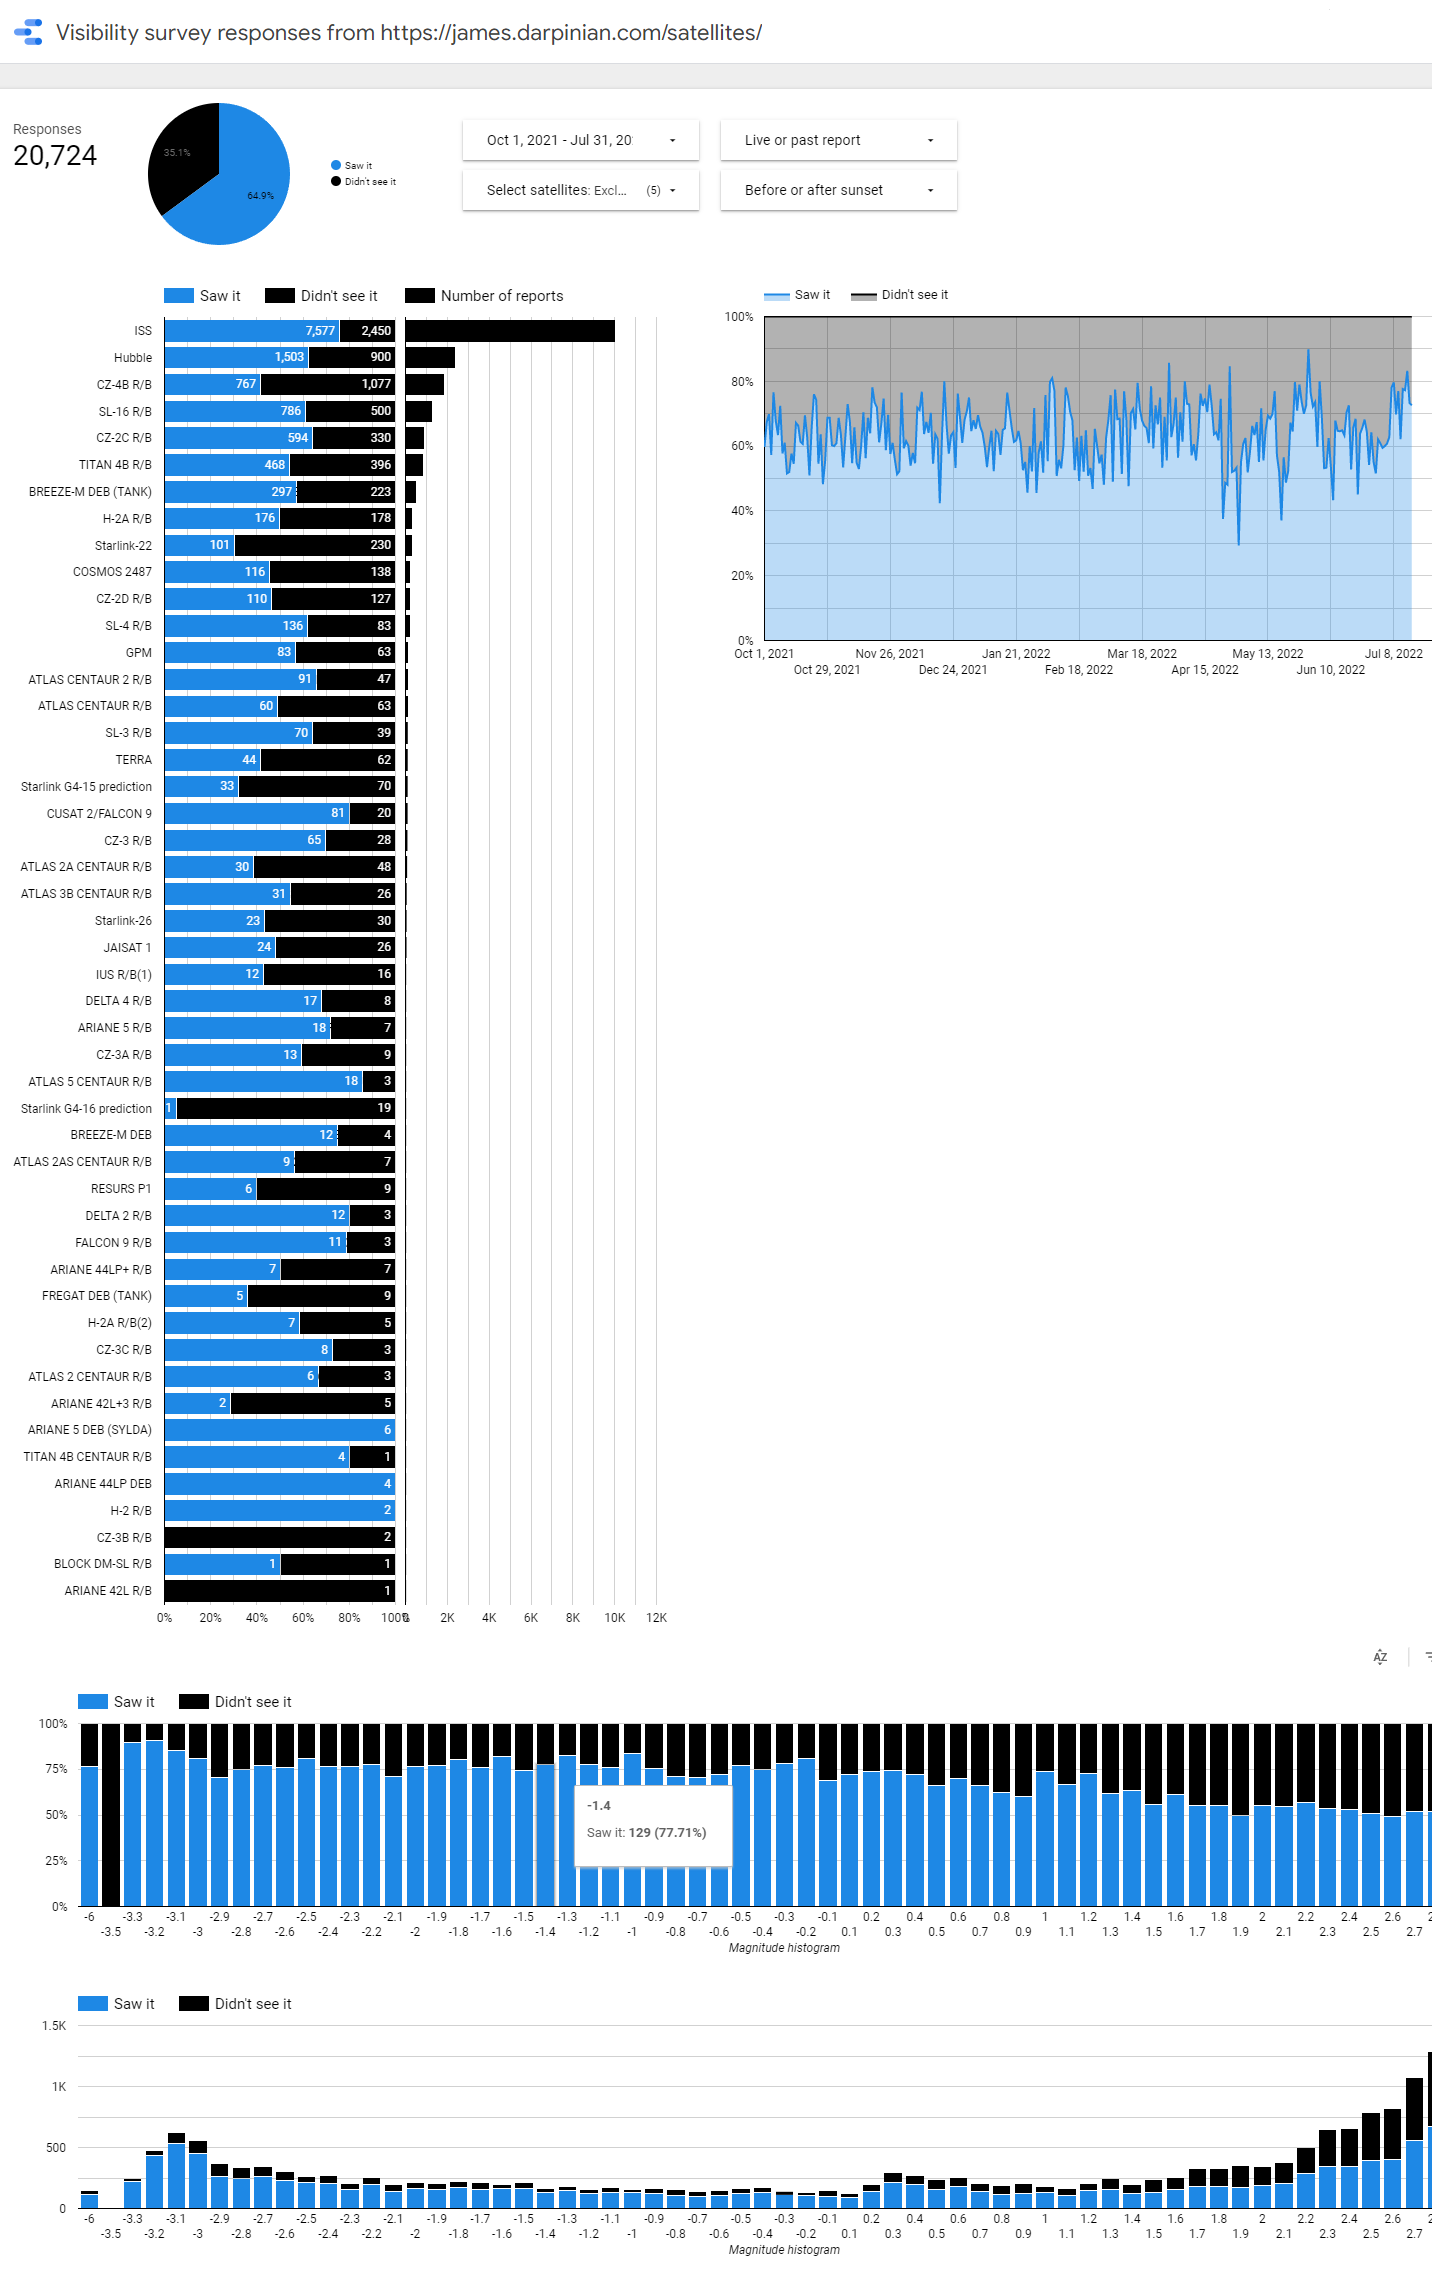
Click for big.
Change Location
There is a small link on the right hand side that allows you to change your location by typing an address. One subtlety here is that all times are displayed in your local time zone according to the setting of your computer's clock. But if I'm in America and I change my location to Tokyo for whatever reason, I probably want to see times in Tokyo local time. So when you choose a location with a different time zone to yours, I display all times in the chosen location's local time zone and add time zone abbreviations to all displayed times so that you know what's happening.
This was surprisingly tricky to get right. Or maybe not surprising if you've worked a lot with time zones.
Starlink mode and EQUiSat mode
There's no button to activate Starlink mode, but the URL is https://james.darpinian.com/satellites/?special=starlink. This filters the view to only show Starlink satellites. It also adds some explanatory text which includes the latest Starlink launch that is known to the site, so you can check to make sure it's up-to-date with the latest launch.
Starlink mode has one other hidden feature: future launch predictions. Celestrak has started posting predicted satellite orbits for Starlink launches before they happen, based on data coming directly from SpaceX. This is especially good for Starlink because the sooner you can see Starlink after launch, the closer the satellites will be and the cooler it will look. This has been a tricky feature to maintain so it is sometimes broken, but if you see text saying "The next Starlink launch is _" on the site, that's the future launch predictions feature working. Note that SpaceX changes their launch plans frequently so there is no guarantee the satellites will be launched at the predicted time!
There was one other special satellite mode for EQUiSat. I added this mode at the request of someone on the Brown University team that launched it. EQUiSat was supposed to shine LED lights that would be visible to the human eye, allowing it to be visible even when not in direct sunlight, so this mode changed the visibility calculations to show the satellite even when it was in Earth's shadow. I'm not sure if anyone was ever able to catch a confirmed sighting though. EQUiSat deorbited in 2020 so this mode no longer works.
Backend tech
My first goal in choosing backend technology was to host the site for free. I'm using Google App Engine (the Python 2 version) as the main web server and backend, with Cloudflare's free CDN in front. I don't know how Cloudflare justifies the cost of providing free CDN services to everyone, but the pairing with App Engine works really well. Crucially, the site is almost completely static, with all dynamic content handled on the client side. So Cloudflare caches everything, and even under heavy traffic App Engine itself stays under the daily free bandwidth allowance every day.
There are two exceptions to the static content. First, I have one dynamic endpoint exposed for IP Geolocation (which App Engine provides automatically on every request, and I simply echo back to the client), and that bypasses Cloudflare. Second, I update the satellite ephemeris (orbit) data every 8 hours, using an App Engine cron job that requests the data from space-track.org and celestrak.com among others. Since this data changes slowly Cloudflare can still cache it, and I simply purge that file from the cache every 8 hours.
This setup can scale to infinity and costs practically nothing. On days that I have a huge traffic spike, thousands of times above normal, I might get charged a few cents of App Engine bandwidth fees, as Cloudflare populates its cache worldwide and the IP geolocation service gets hit more often. Otherwise the cost is $0, and I've never had a single issue related to scaling. I believe that even if I was linked on the Google homepage, Cloudflare and App Engine together would easily handle the traffic.
APIs, Libraries, and Services
The site is built on a dizzying array of underlying technologies. It's a real strength of the web platform that it's easy to integrate all these things together, even as a solo developer. Here's an incomplete list of things I'm using:
Browser features:
- WebGL (3D Globe)
- Geolocation API
- Web Assembly (SGP4 propagator)
- Web Workers (satellite visibility calculations)
- Service Workers (Offline support)
- Web App Manifest (PWA installation)
- Web Share API
- Web Notifications API
- CSS/SVG Filters (night mode for Street View)
Services and APIs:
- Google App Engine (main web server, IP Geolocation)
- Google Cloud Functions
- Cloudflare (free unlimited CDN)
- Google Maps API (Street View and Geocoding)
- space-track.org, 18th Space Defense Squadron (Satellite orbit data, TLEs)
- Celestrak.org (Starlink orbit telemetry)
- Google Analytics
- open-meteo.com (cloudiness forecasts)
- Google Play Store (Store listing for PWA on Android)
- Microsoft Store (Store listing for PWA on Windows)
- Google Calendar (notifications)
- OpenMapTiles (Globe imagery)
- Mike McCants (Satellite brightness data)
- MMT-9 (Satellite brightness data — Mini-MegaTORTORA belongs to Kazan Federal University; Karpov et al. 2016, RMxAC 48, 112)
- Mallama et al. (Constellation photometry and phase functions)
- Unofficial SpaceX REST API (Starlink launches)
- Firebase (Web Notifications API backend)
Libraries:
- Cesium.js (3D Globe, space-related geometric calculations)
- SGP4 satellite orbit propagator
- Bootstrap (Styling)
- Font Awesome (icons)
- moment.js (time calculations and string formatting)
- VirtualSky planetarium
- Emscripten (for porting SGP4 C++ code)
- JQuery (obligatory dependency of some other stuff)
- popper.js
And of course I couldn't have made the site at all without probably thousands of Google searches turning up all sorts of information helpfully written by people about all these technologies, how to calculate satellite visibility, how to vertically center a div, etc etc. No matter how much experience I get as a programmer, I always rely on the wisdom people have helpfully donated to the internet, in everything I make. Hopefully I can contribute back a little with posts like this as well!
Motivation
Why did I decide to make See A Satellite Tonight in the first place, you might ask? I had the idea in 2019 when SpaceX first started launching launching their Starlink satellites.
A Starlink launch is a unique sight in the night sky. With the right conditions, you can see all 60 satellites as bright stars following each other in a train across the sky. I really wanted to catch a view of it myself, and tried using the existing websites such as Heavens-Above and others.
Now these sites are all great, and I was able to catch some Starlink trains. But when talking to people about it, I realized that a lot of people don't know that you can even see satellites at all. Others assume that you need special equipment like a telescope. And even people who know that you can see satellites might have trouble interpreting the charts and tables on Heavens-Above to actually find satellites in the sky.
Even I had trouble using Heavens-Above to find satellites, and I know a lot about satellites. My first job out of college was simulating satellite orbits and sensors at Northrop Grumman Space Systems. I felt that there ought to be a better way: something that would just show you exactly where in the sky to look. I knew it could be so easy that anyone could do it.
Launch
I imagined that people would come across my site, even people who had no prior interest in satellites or the night sky at all, and it would immediately tell them that ISS is coming over in five minutes, and they'd go out and see it and be amazed at the sheer craziness of knowing that there are people up there. They'd grab their child or their parent and show them too, and it would spark an interest in science and space in a few more people in the world.
I'm happy to report that my vision came true just as I imagined. It's been very gratifying to receive messages describing how people have shown their children ISS passing over and how excited they are to see it. It's really a case of "build it and they will come", and I feel lucky that the site has gotten the exposure that it has. I get visitors from all over the globe as well, with clear spikes from specific cities in places like Brazil, Turkey, or New Zealand when a Starlink train happens to pass over and people wonder what they just saw.
My first initial traffic spike came in September 2019 from Hacker News, where I got some really nice comments. It also was popular on a few subreddits. But the single biggest source of traffic for the site, especially for sustained traffic over time, has been, surprisingly, Facebook. I've consistently gotten more traffic from Facebook than Google. A lot of the sharing seems to be private so I'm not sure where the traffic is coming from exactly. I also periodically get local news articles about Starlink that point to the site.
Overall I'm really happy with how the site turned out and the reception it's gotten. I don't have a lot of time to work on it these days, but I'll definitely be maintaining it for the foreseeable future. And I'm excited for the upcoming launch of SpaceX's Starship, which should be sight to behold in the sky when it releases even larger batches of bigger Starlink v2 satellites all at once. I expect that will create a new wave of traffic from people curious about what they just saw in the sky.